Covid19 Analysis
The lockdown in France will end on Monday 11th May 2020 and I wanted to take a snapshot of the situation in France using a statistical analysis. To do this analysis, I used the software R.
The data used in this article come from this Github project: OpenCOVID19 France. A big thanks to all its contributors. They aggregate data from the French Health Minister, Regional Health Agencies and Prefectures. The data contains the number of people infected, cured, hospitalized, in resuscitation, and dead. All these numbers are split by region and department.
Situation in France
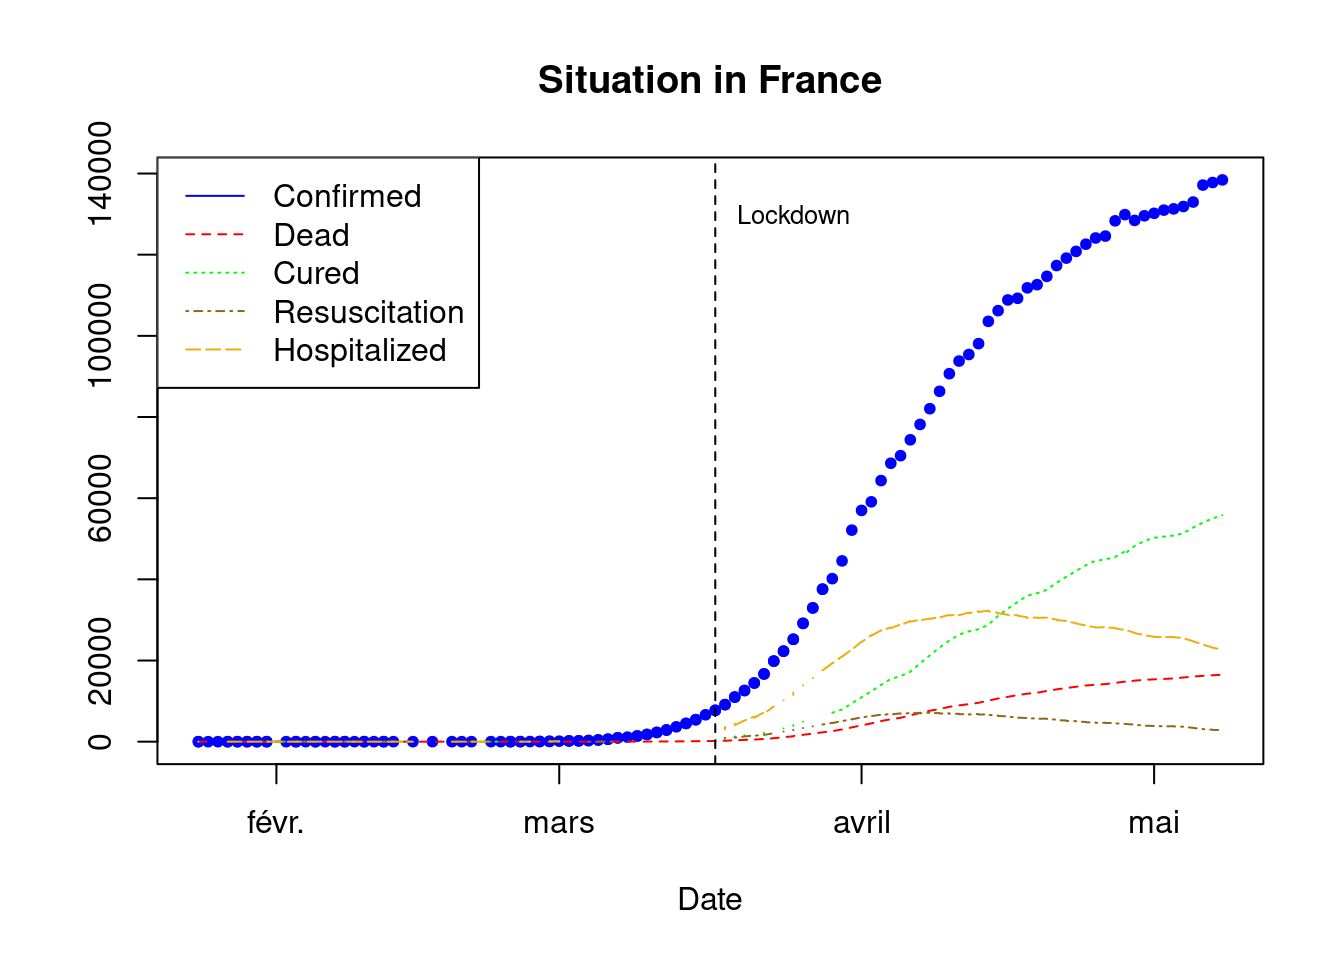
The lockdown has been established on 17th March 2020.
On 8th May 2020, the situation in France is:
| Case | Number |
|---|---|
| confirmed | 138421 |
| dead | 16497 |
| resuscitation | 2868 |
| hospitalized | 22724 |
| cured | 55782 |
The number of dead people does not include people dead in nursing home nor at home.
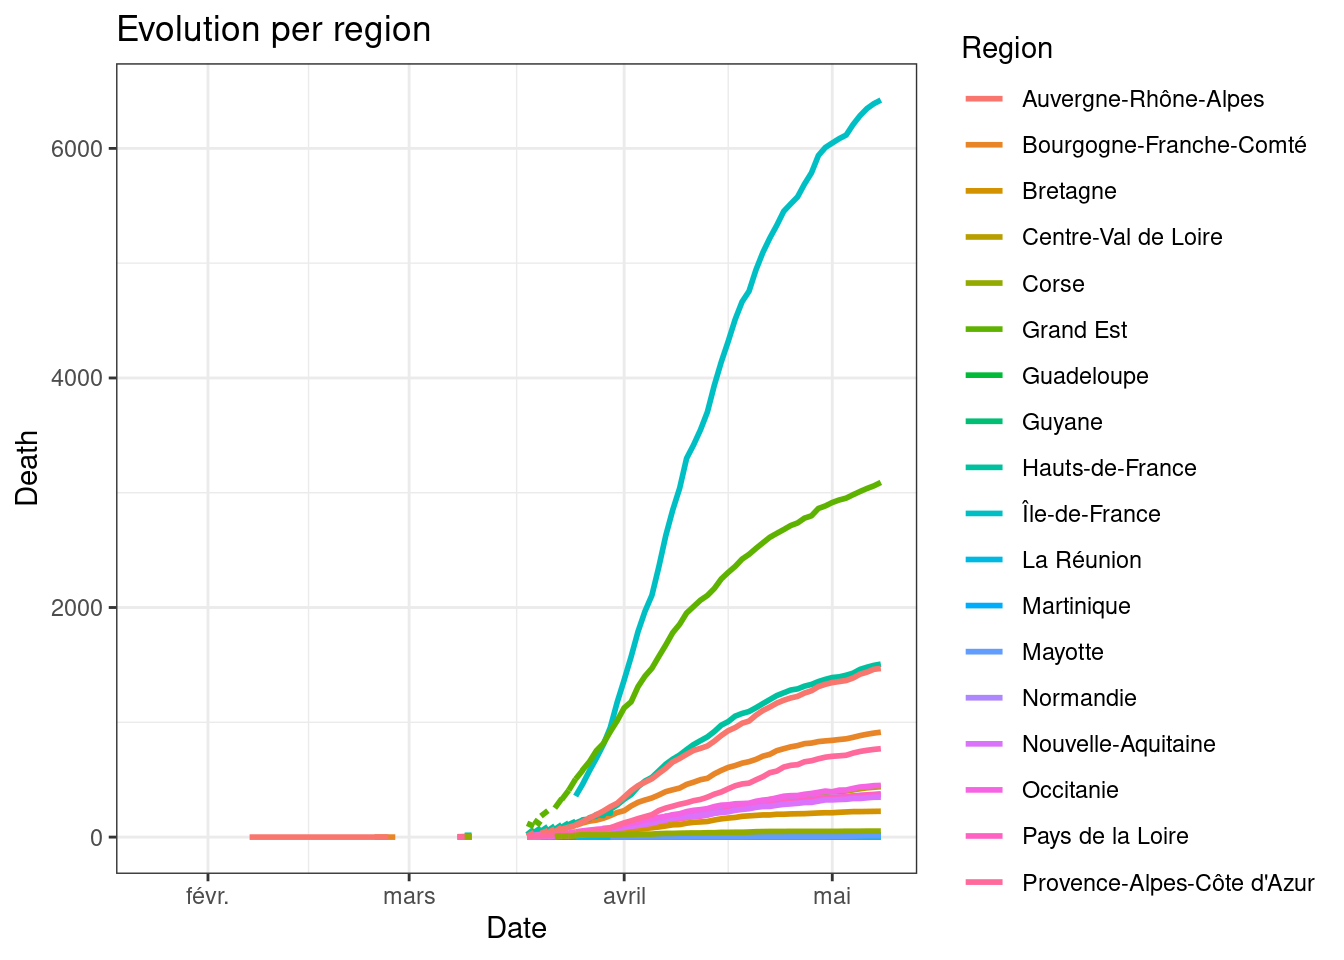
Evolution per Region
Death per region
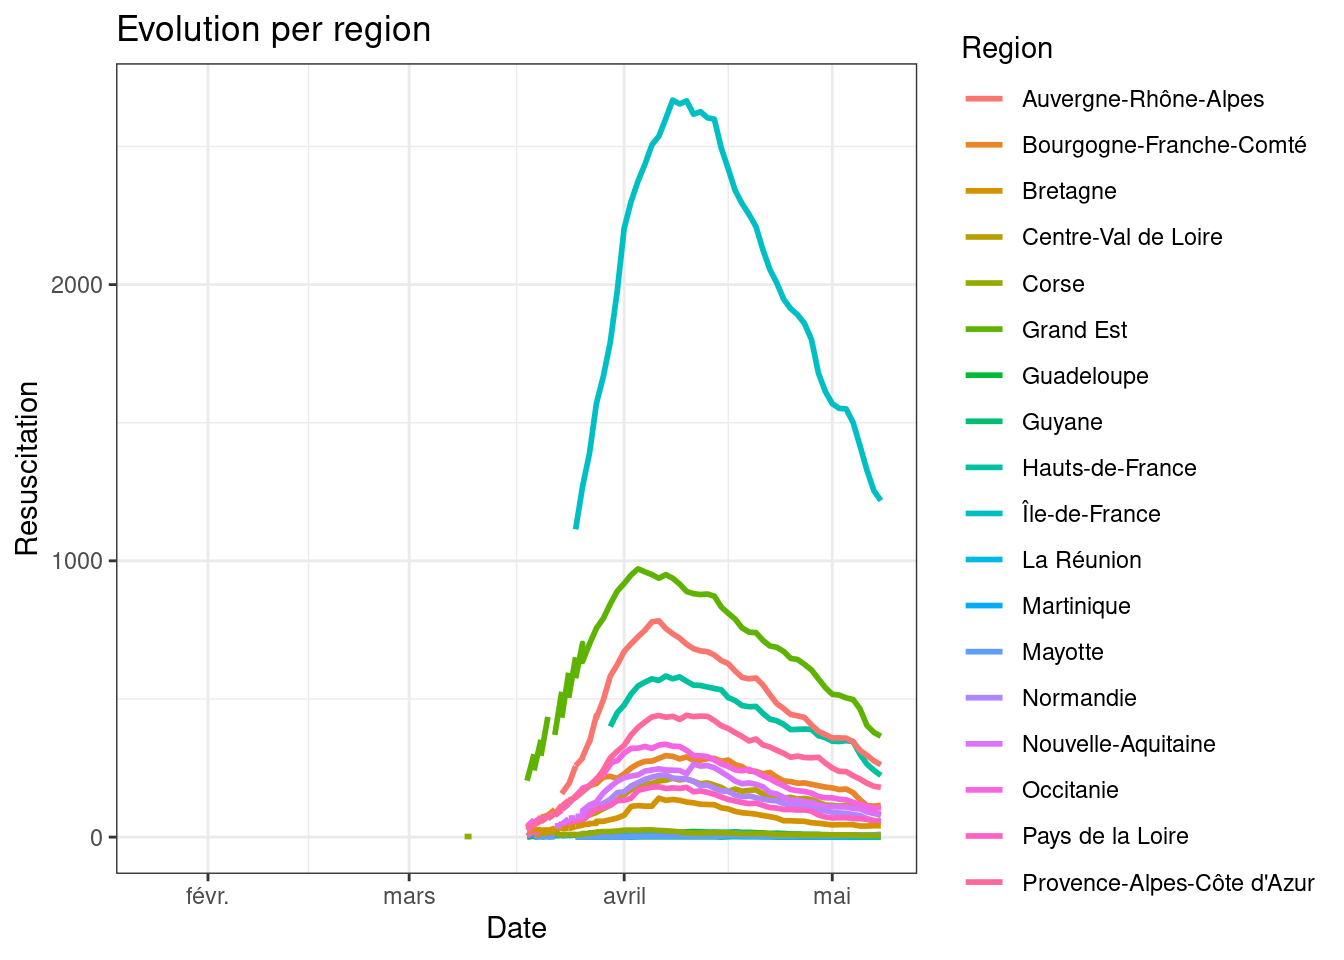
Resuscitation per region
Hospitalized per region
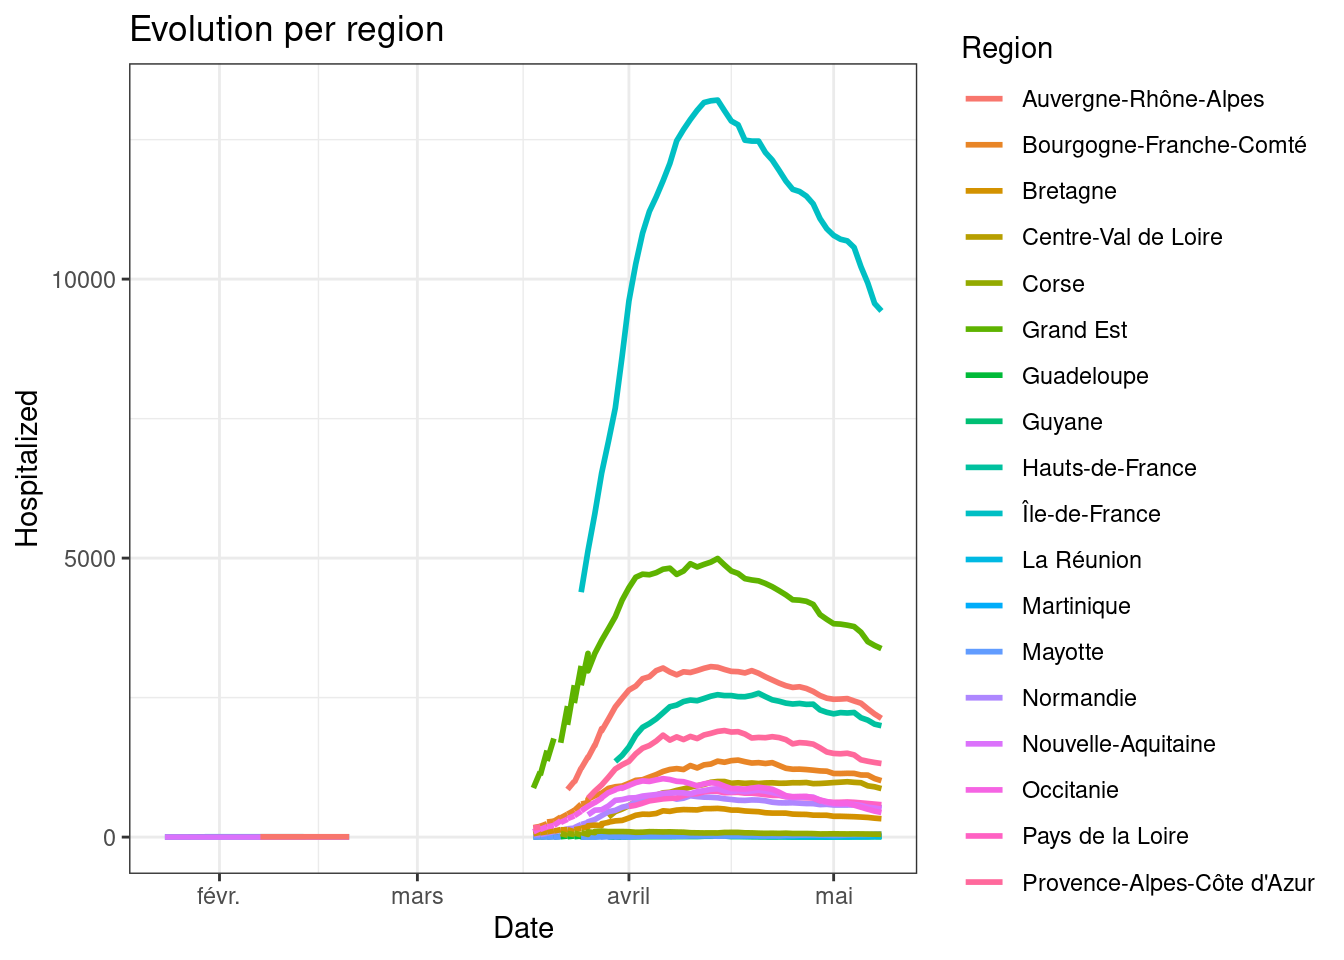
The Paris region is the most heavily populated and so the most impacted by the virus. As we can see from the graphs, the Paris region is followed by the region “Grand Est”, one of the epidemic focuses.
Situation per department
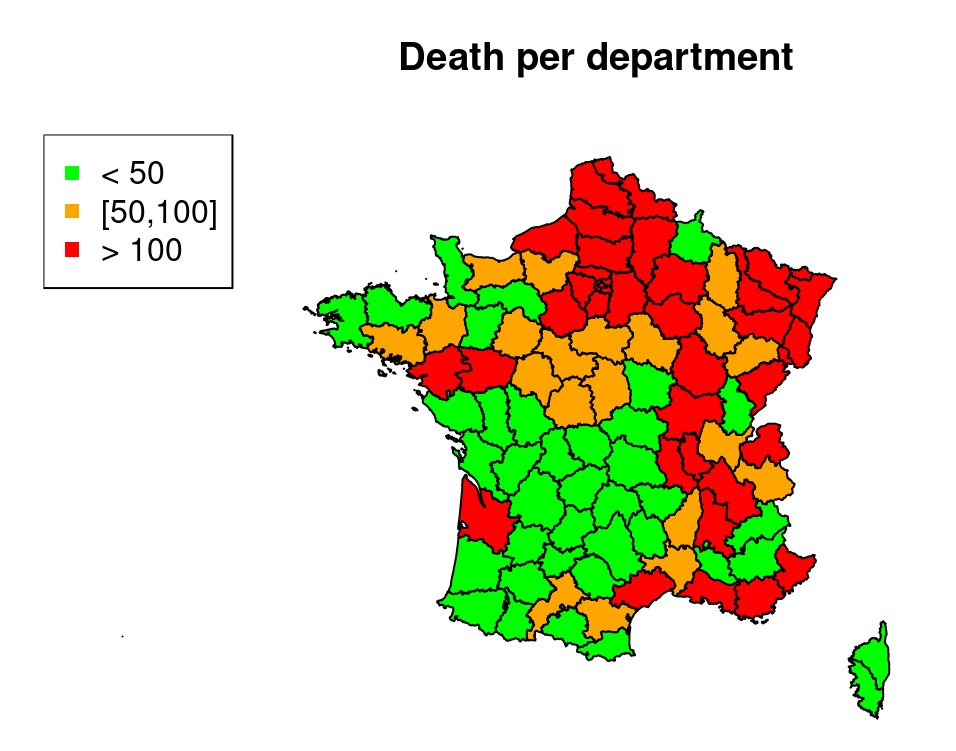
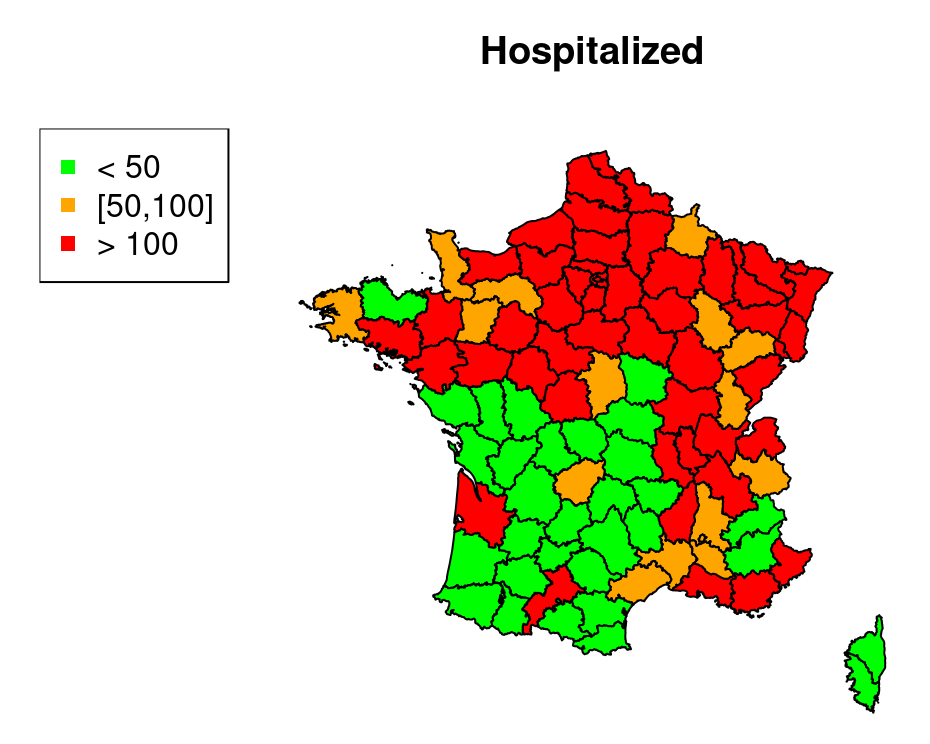
By comparing those two France maps, we can see that the most infected and impacted area are located in the North and in the East.
One interesting graphic published by French government is the occupancy rate of resuscitation beds per department.
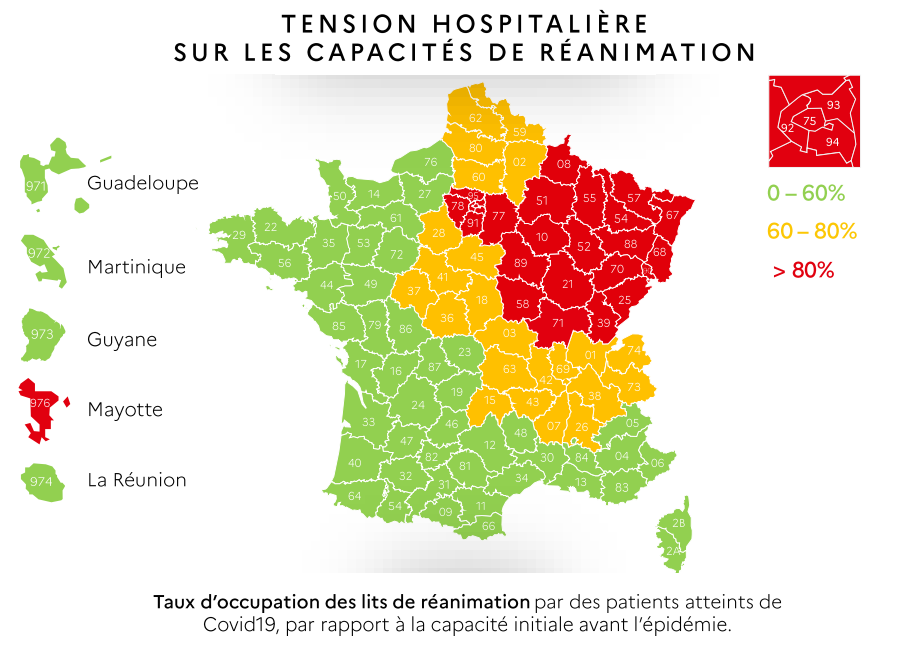
I tried to do the same but I only found the numbers of resuscitation bed in 2018. With those numbers, the resulting map is more “green”.
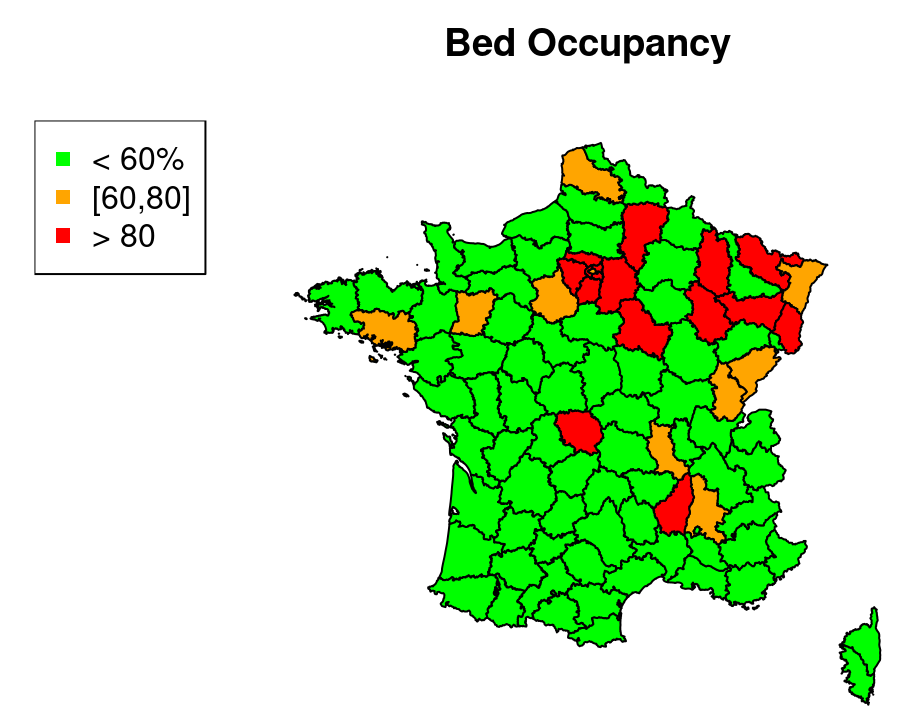
One can assume that the number of beds has been reduced since 2018.